Machine Learning Metrics
Accuracy and Loss
- Loss (not in %) can be seen as a distance between the true values of the problem and the values predicted by the model. Greater the loss is, more huge is the errors you made on the data.
- Loss is often used in the training process to find the "best" parameter values for your model (e.g. weights in neural network). It is what you try to optimize in the training by updating weights.
- Accuracy (in %) can be seen as the number of error you made on the data.
- Accuracy is more from an applied perspective. Once you find the optimized parameters above, you use this metrics to evaluate how accurate your model's prediction is compared to the true data.
- That means :
- a low accuracy and huge loss means you made huge errors on a lot of data
- a low accuracy but low loss means you made little errors on a lot of data
- a great accuracy with low loss means you made low errors on a few data (best case)
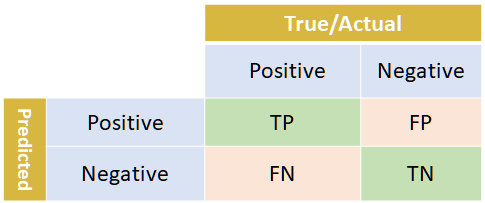
Prediction
- Condition Positive (P) : the number of real positive cases in the data
- Condition Negative (N) : the number of real negative cases in the data
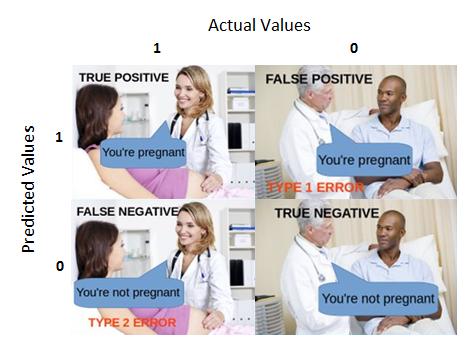
- True Positive or Hit
- True Negative or Correct Rejection
- False Positive or False Alarm or Type I error
- False Negative or Miss or Type II error
Accuracy
- Accuracy (ACC) = (Σ True positive + Σ True negative)/Σ Total population
- Accuracy = (TP + TN)/(TP + TN + FP + FN)
- Accuracy is sensitive to class imbalance
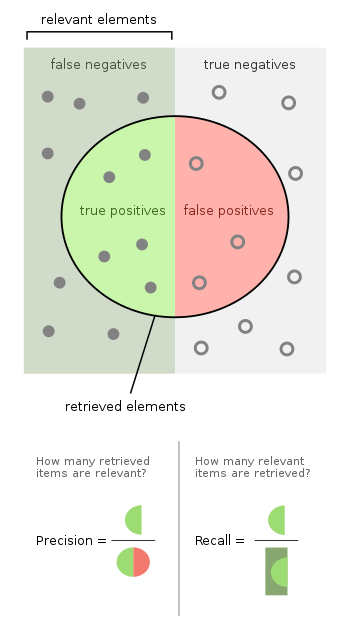
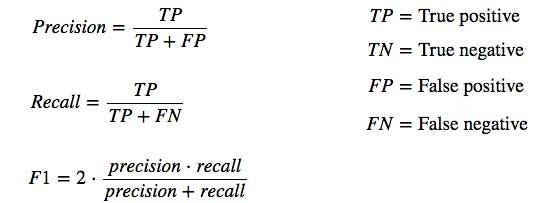
Precision or Positive Predictive Value (PPV)
- Precision measures how accurate is the predictions.
- Precision is the percentage of the predictions are correct.
- Precision measures the "false positive rate" or the ratio of true object detections to the total number of objects that the classifier predicted.
- Precision: how many selected items are relevant.
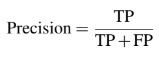
- Precision, a.k.a. positive predicted value, is given as the ratio of true positive (TP) and the total number of predicted positives.
- Precision = Σ True positive/Σ Predicted condition positive
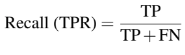
Recall or Sensitivity or True Positive Rate or Probablity of Detection
- Recall measures how good the algorithm find all the positives.
- Recall measures the "false negative rate" or the ratio of true object detections to the total number of objects in the data set.
- Recall: how many relevant items are selected.
- Recall : the ratio of TP and total of ground truth positives.
- Recall = Σ True positive/Σ Condition positive
F1 Score
- Harmonic mean of Precision and Recall
- Because it is difficult to compare two models with low precision and high recall or vice versa.
- So to make them comparable, F-Score is used.
- F1 score = 2 · (Precision · Recall)/(Precision + Recall)
Matthews Correlation Coefficient (MCC) or Phi Coefficient
- MCC is used in machine learning as a measure of the quality of binary (two-class) classifications
- MCC takes into account all four values in the confusion matrix, and a high value (close to 1) means that both classes are predicted well, even if one class is disproportionately under- (or over-) represented.

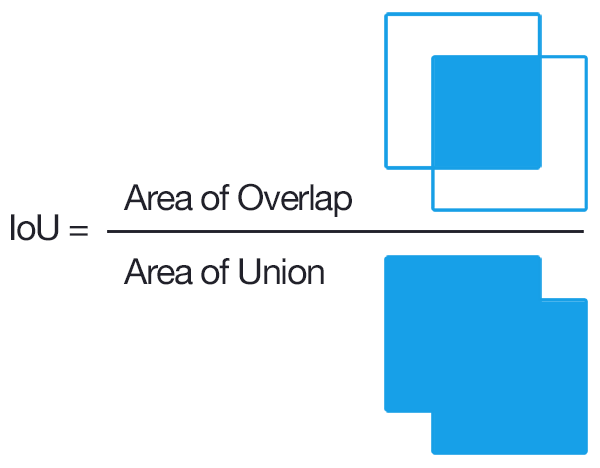
Intersection over Union (IoU)
- IoU is used for detection algorithm
- The IoU is given by the ratio of the area of intersection and area of union of the predicted bounding box and ground truth bounding box.
- an IoU of 0 means that there is no overlap between the boxes
- an IoU of 1 means that the union of the boxes is the same as their overlap indicating that they are completely overlapping
- The IoU would be used to determine if a predicted bounding box (BB) is TP, FP or FN. The TN is not evaluated as each image is assumed to have an object in it.
- Traditionally, we define a prediction to be a TP if the IoU is > 0.5, then:
- True Positive (if IoU > 0.5)
- False Positive (if IoU < 0.5 or Duplicated Bounding Box)
- False Negative, when our object detection model missed the target (if there is no detection at all or when the predicted BB has an IoU > 0.5 but has the wrong classification)
- mean Average Precision (mAP) score is calculated by taking the mean AP over all classes and/or over all IoU thresholds. Mean average precision (mAP) is used to determine the accuracy of a set of object detections from a model when compared to ground-truth object annotations of a dataset.
Note: - What is Mean Average Precision (mAP) in Object Detection?
- Mean Average Precision (mAP) Explained - Paperspace Blog
- mAP (mean Average Precision) might confuse you! - by Shivy Yohanandan - Towards Data Science
Reference
- Precision and Recall
- Metrics for Object Detection and Segmentation
- Introduction of Metrics for Object Detection
- Object Detection Metrics
- Popular ML Evaluation Metrics, ML Metrics, other Metrics, other metrics
- IoU for Object Detection
- Breaking Down MaP
- MaP for Object Detection
- Mathews Correlation COefficent
- IoU better detection
- Data Science in Medicine—Precision & Recall or Specificity & Sensitivity? - by Alon Lekhtman - Towards Data Science
- When Accuracy Isn't Enough, Use Precision and Recall to Evaluate Classification Models - Built In
Multiclass Metrics
- Multi-Class Metrics Made Simple, Part I: Precision and Recall - by Boaz Shmueli - Towards Data Science
- Beyond Accuracy: Precision and Recall - by Will Koehrsen - Towards Data Science
- How to Calculate Precision, Recall, and F-Measure for Imbalanced Classification
- Metrics to Evaluate your Machine Learning Algorithm - by Aditya Mishra - Towards Data Science
Accuracy, Precision, Error
- Accuracy is closeness of the measurements to a specific value
- More commonly, it is a description of systematic errors, a measure of statistical bias; low accuracy causes a difference between a result and a "true" value. ISO calls this trueness.
- the accuracy of a measurement system is the degree of closeness of measurements of a quantity to that quantity's true value
- bias is the amount of inaccuracy
- Precision is the closeness of the measurements to each other
- Precision is a description of random errors, a measure of statistical variability.
- The precision of a measurement system, related to reproducibility and repeatability, is the degree to which repeated measurements under unchanged conditions show the same results.
- variability is the amount of imprecision
Accuracy has two definitions:
- More commonly, it is a description of systematic errors, a measure of statistical bias; low accuracy causes a difference between a result and a "true" value. ISO calls this trueness.
- Alternatively, ISO defines accuracy as describing a combination of both types of observational error above (random and systematic), so high accuracy requires both high precision and high trueness.

Learn more: